Bibliometrics and citation analysis
Bibliometrics is the statistical analysis of bibliographic data. It is increasingly used to measure the impact of research, for example in the UK’s Research Excellence Framework (REF). There are various metrics and tools available, for example:
- Journal impact factors from Journal Citation Reports
- Essential Science Indicators
- SJR (SCImago Journal Rank) and SNIP (Source Normalized Impact per Paper)
- Eigenfactor
- Google Scholar Metrics
- Publish or Perish
- Altmetrics
- Subject-based metrics
- ORCID identifier
- ResearchGate Score
- Leiden Manifesto for research metrics
New to bibliometrics? - MyRI (My Research Impact) is a suite of online tutorials covering bibliometrics topics including how to calculate your H-Index, citation analysis tools, Journal Citation Reports and more. An online resource called the Metrics Toolkit explains how different metrics are calculated, what their limitations are and provides appropriate and inappropriate use cases.
Want to know about responsible metrics?
Journal Impact Factor - Journal Citation Report
To assess the impact of a particular journal Stirling University provides access to Journal Citation Reports. This is a tool for journal evaluation, using information drawn from over 8,400 journals. There are two editions, published annually: science and social science. See online learning resources for JCR.
ERIH PLUS (formerly European Reference Index for the Humanities)
European Reference Index for the Humanities: There is no humanities list in the Journal Citation Reports so you may find this academic journal index for the HSS (Humanities and Social Sciences) society in Europe helpful.
Part of the Web of Science service, Essential Science Indicators provides access to a wide range of science performance statistics and trends including citation data.
SCImago Journal Rank (SJR) is a measure of the influence of scholarly journals that accounts for both the number of citations received by a journal and the importance or prestige of the journals where such citations come from. This results in a size-independent indicator that ranks journals by their ‘average prestige per article’. SJR was developed by researchers in Spain and uses the information contained in the SCOPUS database (Elsevier).
Source Normalized Impact per Paper (SNIP) is the ratio of a journal’s citation count per paper and the 'citation potential' in its subject field. The impact of a single citation is given higher value in subject areas where citations are less likely, and vice versa. Allows direct comparison of sources in different subject fields.
To find a journal’s SJR and SNIP in Scopus:
- In the Portal, select A-Z list of online resources and choose Scopus
- Within Scopus, select the 'Compare sources' link above the search boxes on the right
- Enter a journal title (or ISSN or Publisher)
- In the results, tick the box to the left of any journal title you are interested in
- You will see the SJR values appear in the graph - use the tabs above the graph to switch to see SNIP values
- You can choose up to 10 journals to analyse and compare to each other on the one graph.
Eigenfactor scores and Article Influence scores rank journals much as Google ranks websites. Data from the producers of Web of Science is used in calculating the scores. The site is easy to navigate and a wide range of academic disciplines are included.
Google Scholar Metrics lists every (significant) journal and provides a quick way to gauge the visibility and influence of their recent articles.
- Type the journal name in GSM’s search box (be careful to enter the exact journal name e.g. if the journal uses ‘&’ as part of its title and you enter ‘and’ instead, GSM will just show nothing as found)
- Or browse by the Research Area categories or subcategories on the left hand side of the list.
The list is based on two metrics: h5-index and h5-median - the higher these numbers are the better.
h5-index: The h-index of a publication is the largest number h such that at least h articles in that publication were cited at least h times each. For example, a score of 35 shows that at least 35 of the journal's articles have been cited at least 35 times in the last five full years.
h5-median: The h5-median is a measure of the distribution of citations to the articles over the last five full years. If it is high, then the journal has a peak of high-scoring papers; if lower, it has a tail of lower scoring papers.
Publish or Perish uses Google Scholar data to evaluate journal articles and can be useful for subject areas where there is traditionally little formal evaluation. It is published primarily to assist academics to target papers at journals of an appropriate standard. Publish or Perish uses Google Scholar data to search for articles citing your article of interest.
AltMetrics is the: 'creation and study of new metrics based on the Social Web for analysing, and informing scholarship.' There is a growing list of tools for measuring these alternative metrics.
For example:
-
Altmetric: Altmetric track who is talking about research outputs and what they are saying. It constantly monitors social media sites, blog posts, news stories, Wikipedia, mendeley, Facebook, government policy documents and other sources for mentions of outputs. You can see the Altmetric score for an individual output by clicking on the Altmetric donut wherever you see it, for example in STORRE or a publisher web site.The Altmetric 'score of attention' is a weighted metric that is based on counts of mentions in the various sources Altmetric tracks.
- Altmetric for Institutions at Stirling: A service that helps you monitor and report on the attention research papers are receiving on the web. You can browse the data for all of Stirling's (and others') outputs, create and save reports, set-up email alerts for new activity, and export data to Excel for further analysis. An account is not required to browse the data but is required to save reports and set-up email alerts. Quickly create an account using the sign-in option at the top of the page. See the Altmetric for Institutions Guide.
For example:
- Impactstory: a website that makes it quick and easy to view the impact of a wide range of research output. It 'goes beyond traditional measurements of research output based on citations to papers.' Their metrics cover many different sources – but include metrics like:
- Facebook: Number of users who shared a post about the item and Number of users who Liked a post about the item
- Number of times the item has been tweeted
- PLoS article level metrics
- PubMed Central: the number of times the full-text has been viewed on PubMed Central and number of times the figures have been viewed on PubMed Central
- Delicious: number of bookmarks to this artefact
- Mendeley: The number of readers who have added the article to their libraries
- Scopus: the citation data reported for an article from Scopus
For example:
- Kudos: as well tracking mentions of your publications - Kudos also helps you explain, enrich and share your work:
- you can attach simple, non-technical explanations to your publications, making it more accessible to a broader audience
- provides links to resources related to your publications, for example, presentations, videos, datasets, etc.
- links to your social media accounts and provides templates for emails and blog posts
- From the Kudos 'Manage Account' Page, you can connect to your ORCID ID account. This will instantly import all your ORCID publications into Kudos. When new publications are added to your ORCID, they will also appear in Kudos.
- Kudos User Guide and FAQs.
- Introductory video on Kudos
Some subject areas may have their own lists of ranked journals. For example, the Association of Business Schools produces an Academic Journal Guide annually that provides ranked listings of business and management journals (you will be asked to register, this is free). So check with colleagues whether there is any subject specific ranking for your research area.
ORCID provides a persistent digital identifier that distinguishes you from every other researcher and helps ensure that your work is recognised as yours.
- Register at: http://orcid.org/register
- Import your research outputs and add biographical information using their automated import wizards. You can also export your publication details from a GoogleScholar Profile (see: https://support.orcid.org/hc/en-us/articles/360006973353-Import-and-export-works-via-BibTeX). We have gathered this information all together in a libguide on researcher profiles
- Add your ORCID ID to your Research Management System (RMS) profile
Add your ORCID ID to WorkTribe at the following point in My Profile:
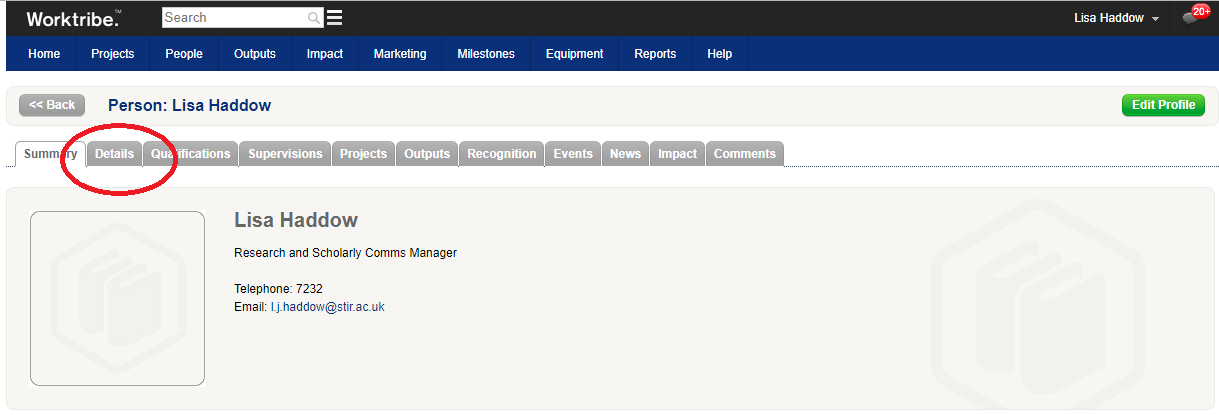
Select the Details tab
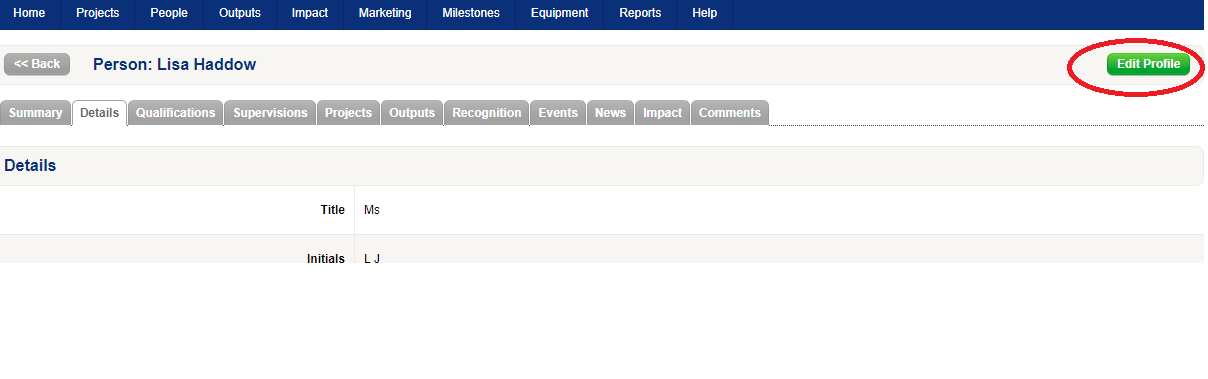
Select Edit Profile and Add your Orcid ID to the field entitled ORCID in the 16 digit format xxxx-xxxx-xxxx-xxxxx
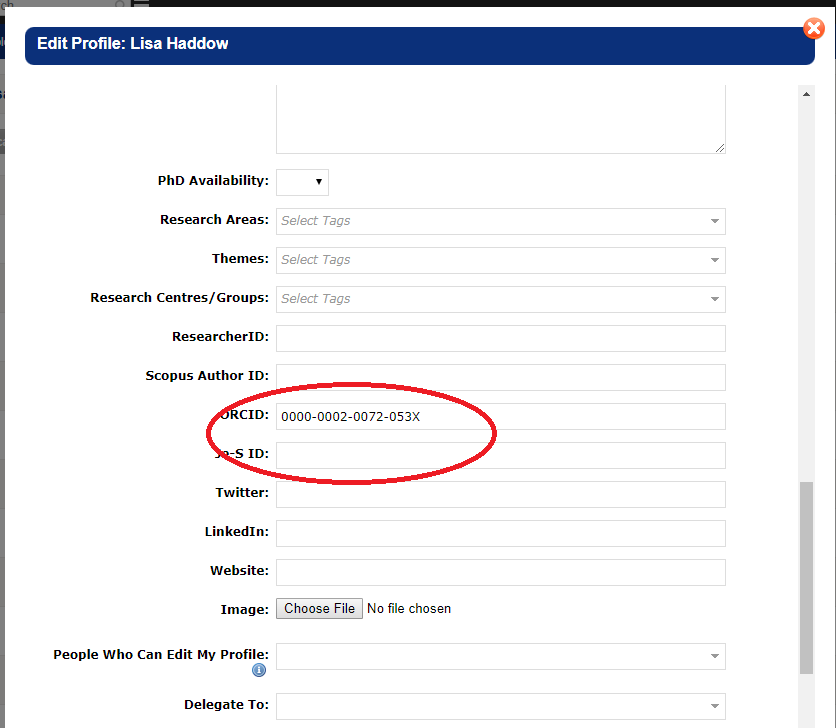
Then click on Update. Worktribe automatically adds the ORCID URL to your profile, e.g., https://orcid.org/0000-0002-0072-053X
According to ResearchGate the ResearchGate Score is a way to measure your scientific reputation.
It has been argued that this Score should not be taken seriously, see:
Leiden Manifesto for research metrics
Metrics about research should be used with great care and understanding so as to avoid misleading and inaccurate interpretations and conclusions. The ten principles outlined in the 'Leiden Manifesto for research metrics' are a very useful guide.